This is an old revision of the document!
Decorrelation plots for foreground models
Sept 14 2018, Clem Pryke
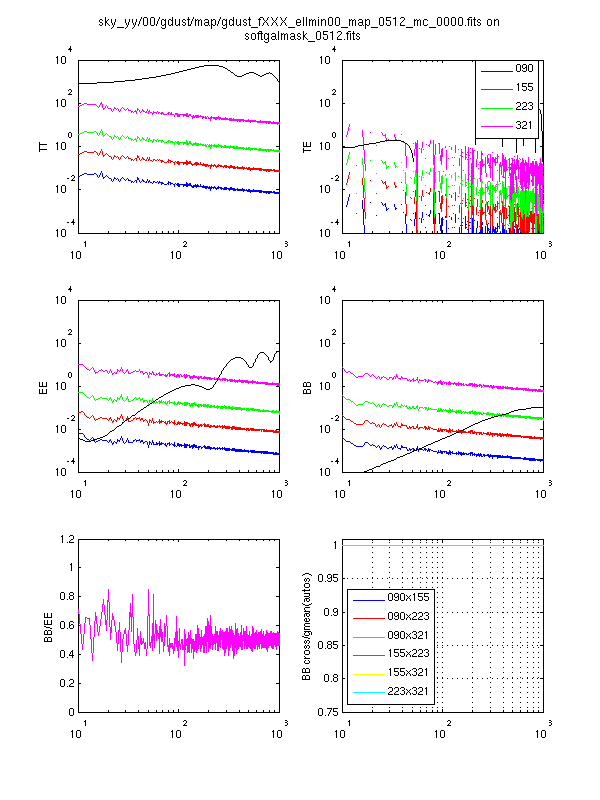
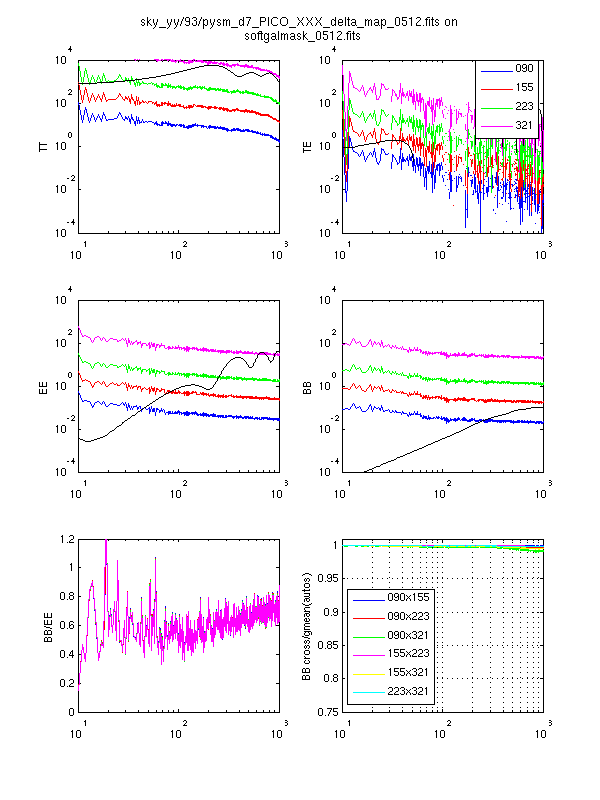
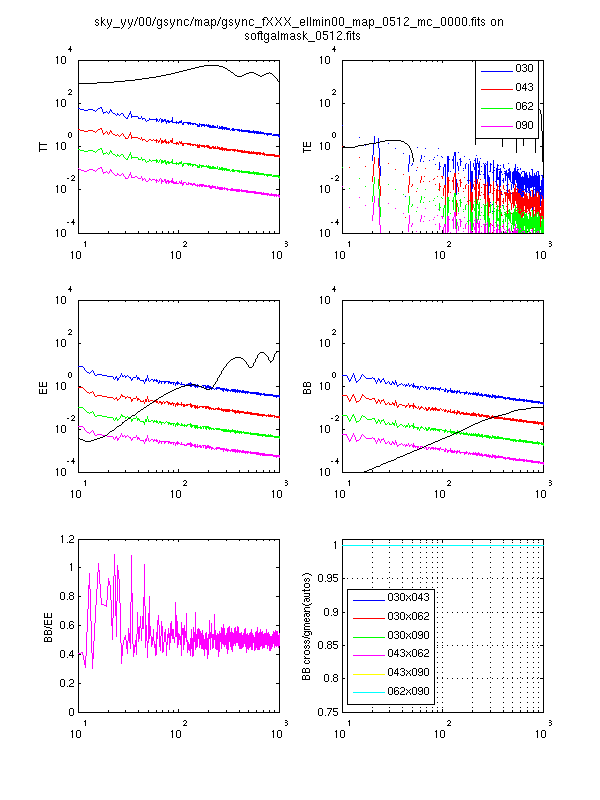
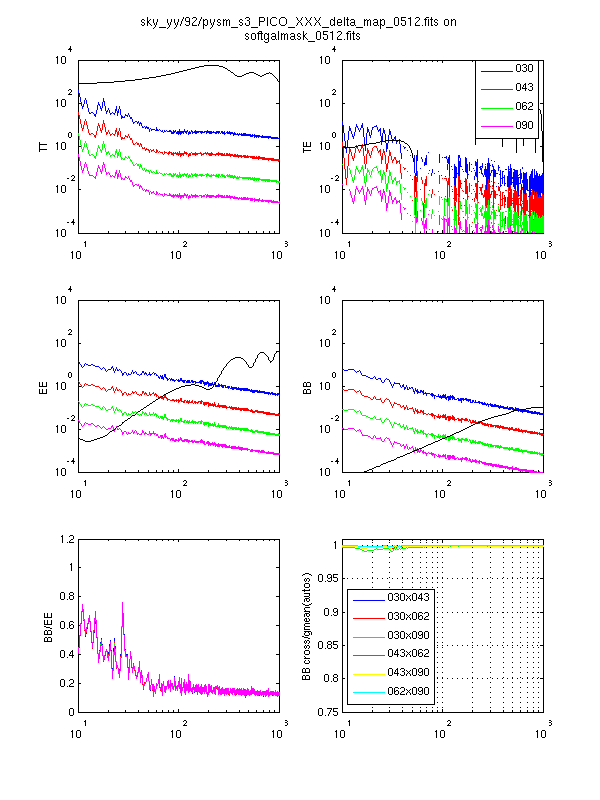
Most of the foreground models we are considering for PICO implement spatial variation of the spectral behavior at some level - this produces “decorrelation” - i.e. the sky pattern for a given foreground component changes as a function of frequency. This potentially degrades the efficiency of the component separation algorithms. In this post I look at the decorrelation of the dust and sync patterns by comparing cross-spectra to the geometric mean of auto-spectra (the lower right panel of each plot). We see that only the 98 and 99 (multi-layer and Vansyngel) models are significantly decorrelated in dust.
I take the power spectra using anafast and the soft edge mask shown below. Since foreground do not have E»B this should be adequate.
To recap the models are:
- 00=Toy Gaussian models for dust and sync with uniform amplitude over the sky at level appropriate for the BICEP/Keck patch (i.e. way too low for PICO large sky coverage).
- 91=PySM a1d1f1s1 arxiv/1608.02841
- 92=PySM a2d4f1s3
- 93=PySM a2d7f1s3
- 96=Brandon's MHD model for dust and sync taken from /global/homes/b/bhensley/mhd_maps/maps_v1 on 180424
- 98=MKD multilayer dust model as described in arxiv/1706.04162. Since only dust is provided this is added to PySM a2f1s3 as per models 92 and 93.
- 99=Vansyngel model as described in arxiv/1611.02577 with multi-frequency extension. This model provides both dust and sync (and no AME or free-free is added.)
So we have 7 models for dust and 5 for sync.
Dust plots
Compare the below to fig 20 of https://arxiv.org/pdf/1706.04162.pdf


Sync plots


