This is an old revision of the document!
Table of Contents
Calibration simulations
In this page we collect information and results about the simulation of the photometric calibration procedure.
Hypothesis
We assume to calibrate the instrument using the solar dipole of the CMB, whose peak-to-peak amplitude is 7 mK. We use TOAST to produce the timelines, and DaCapo to compute the calibration factors.
Observation of the dipole
I used the scanning strategy parameters listed at the page Optimizing Scan Strategy, with no kinematic dipole and the Galactic signal simulated by PySM for a W-band detector, which should be the best case in terms of Galactic contamination.
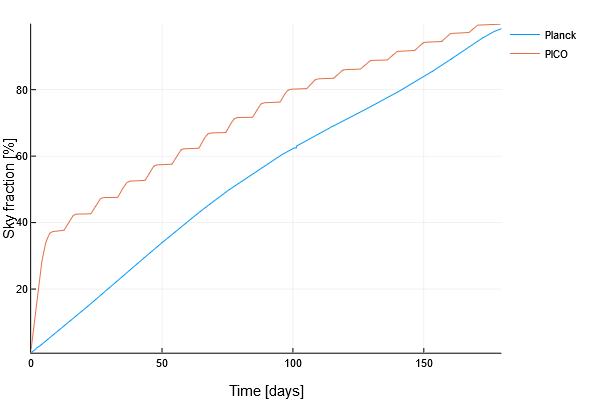
The following plots show a comparison between the proposed scanning strategy for PICO and the strategy used for Planck. This is the sky coverage as a function of time:
The precession allows PICO to observe wider portions of the sky in the same time. This is good for dipole calibration as well, as it allows the detectors to potentially sample larger variations of the dipole, thus increasing the S/N of the dipole measurement.
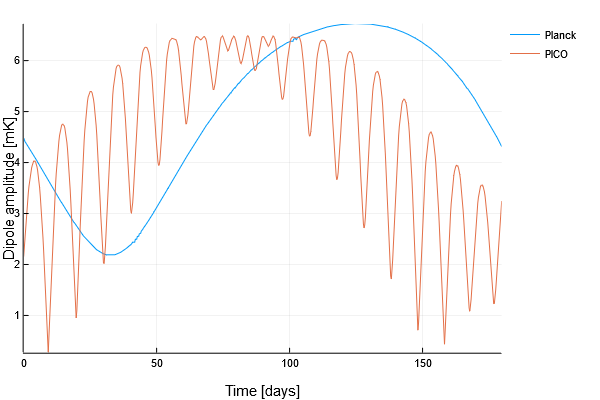
The plot above shows the peak-to-peak variation of the dipole signal over periods of 6 hours. In general, high values (more than 5 mK) are good, lower values (less than 3) are bad, because the signal is not strong enough to allow for a good calibration. Planck followed a very regular scanning strategy, which caused the dipole to be poorly visible for several weeks (this effect was dramatic during the 2nd and 4th sky surveys). The PICO boresight direction often samples the equator of the dipolar signal (which is bad), but such instances are usually short (a few days, and this is good).
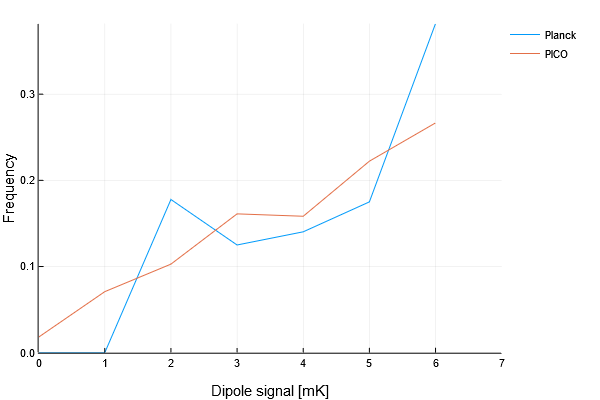
This plot is a histogram of the dipole amplitudes shown in the previous plot.
Running DaCapo
No Galactic mask
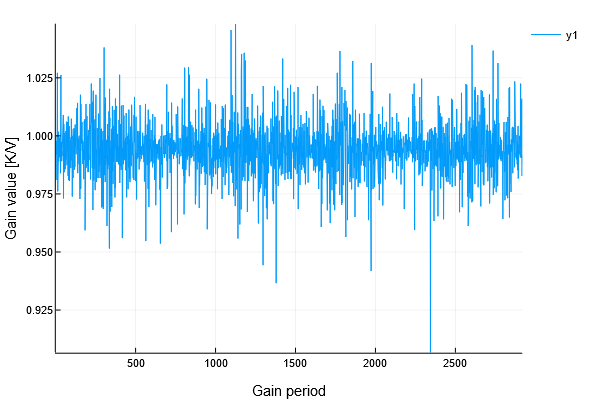
The following plot shows the results of running DaCapo on the 2-year mission, assuming to recompute the gain constant every 6 hours. (This is the same timescale used to produce the plots above, in the section “Observation of the dipole”).
The true gain should be 1.000, but their average 0.994, with a standard deviation of each sample equal to 0.010. This means that the accuracy of the calibration is 0.6% and the error in the gain estimate is 1.0%. We could probably do better if we increase the time span used to compute the gain constant (e.g., from 6 to 24 or 48 hours). In order to do so, we need to understand how much stable we expect the PICO detectors to be.
Using a Galactic mask
The use of a Galactic mask should help to reduce the bias shown above (i.e., gain average is 0.994 instead of 1.0), at the price of increasing the noise (because less data are used in the calculation). The code is still running on NERSC, once results will be available I'll post them here. [This was written on Wednesday, April 4th 2018].


