This is an old revision of the document!
Beams and C(l)
— Eric Hivon 2018/07/16 09:09
2018/07/16
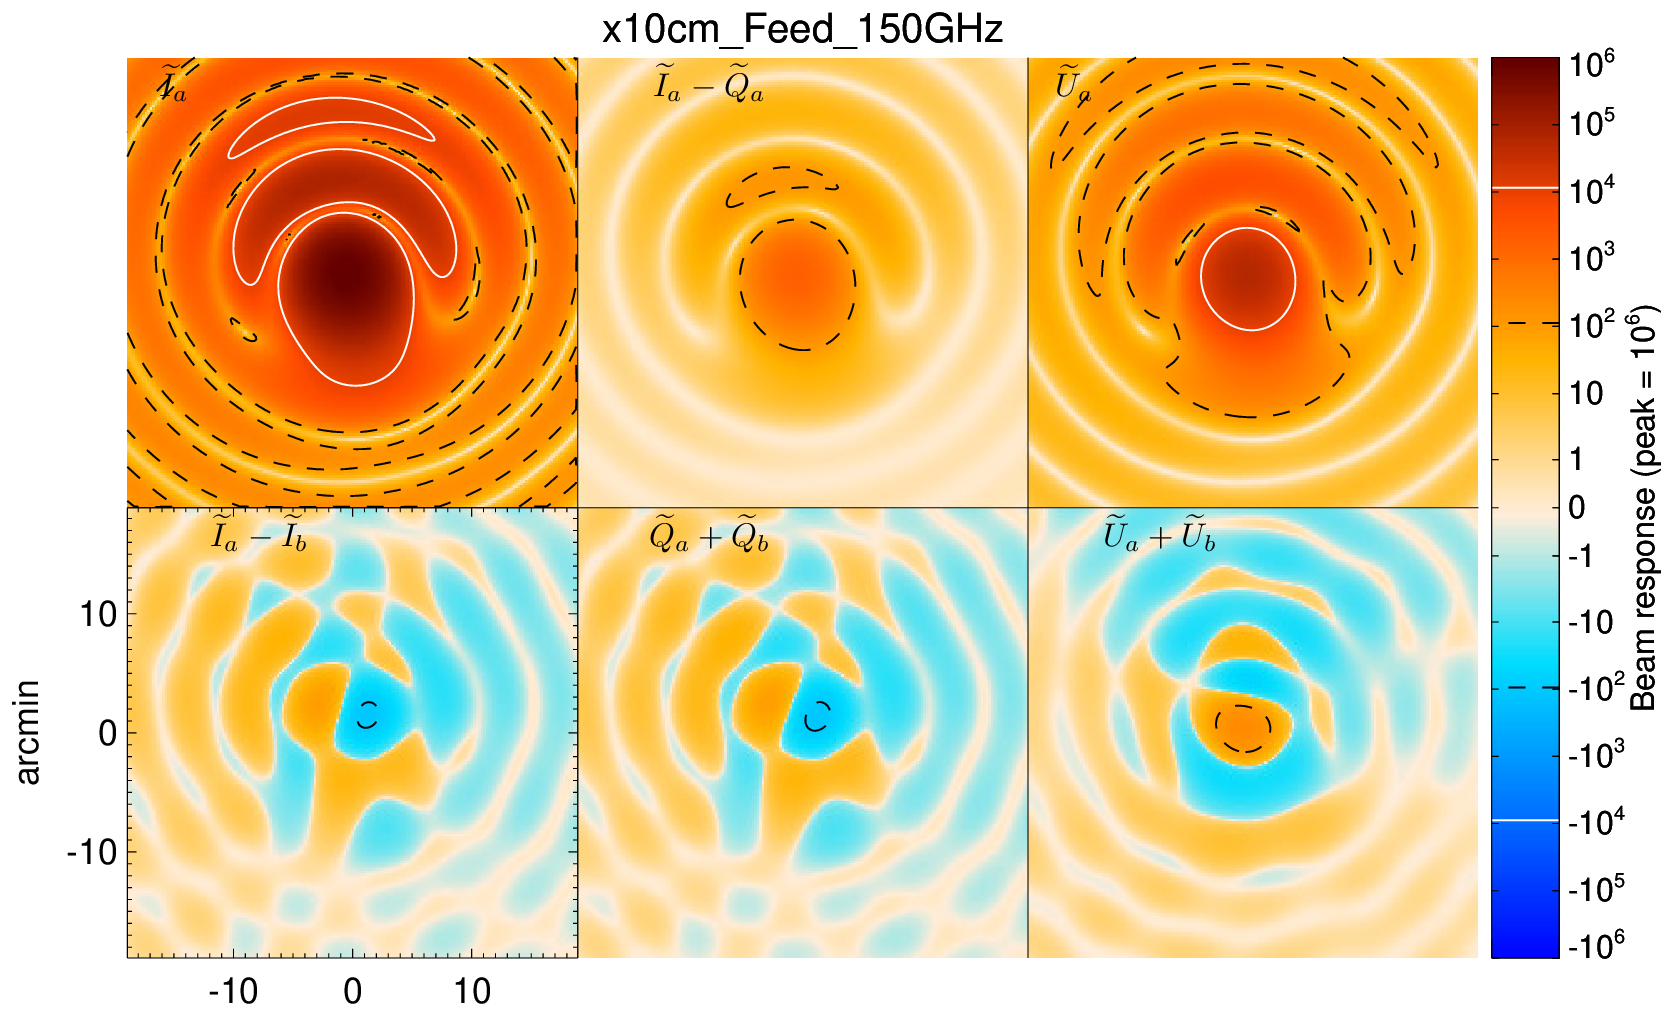
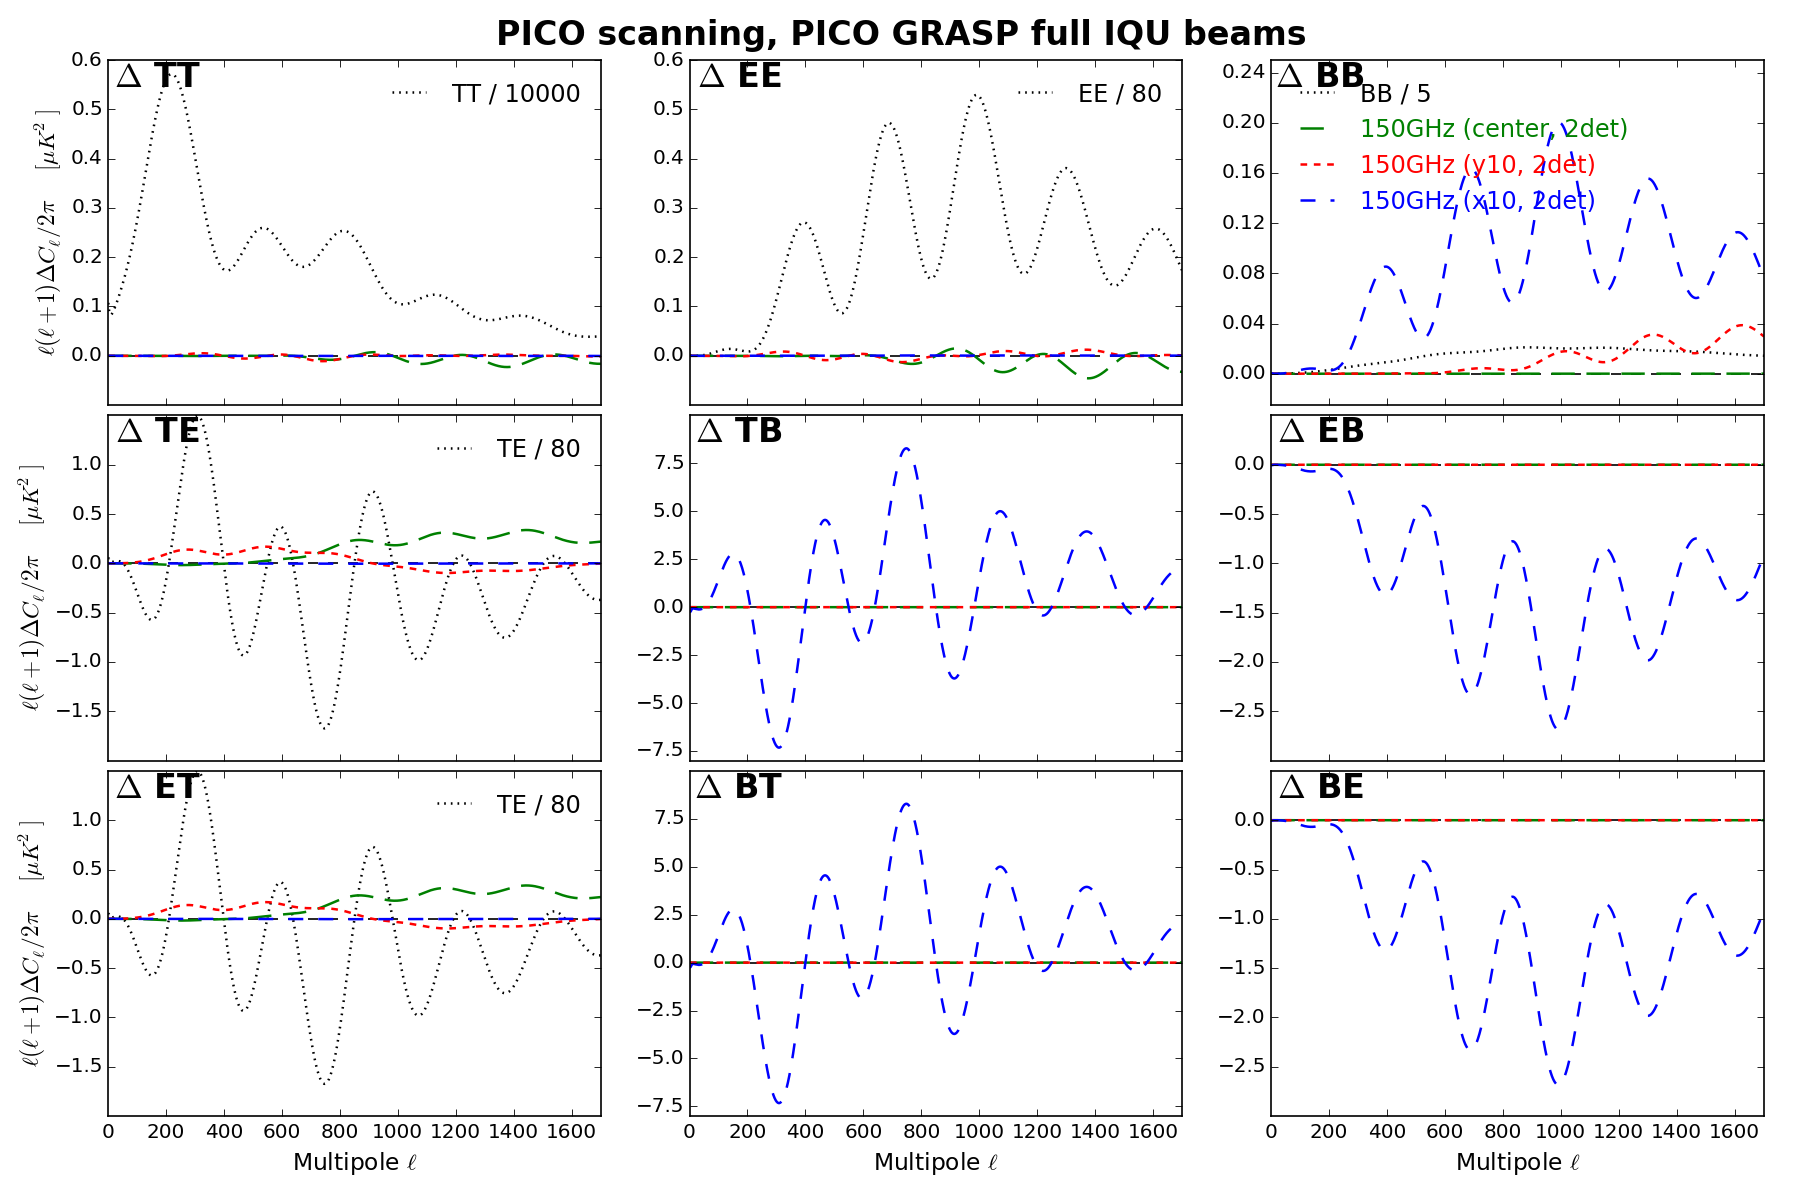
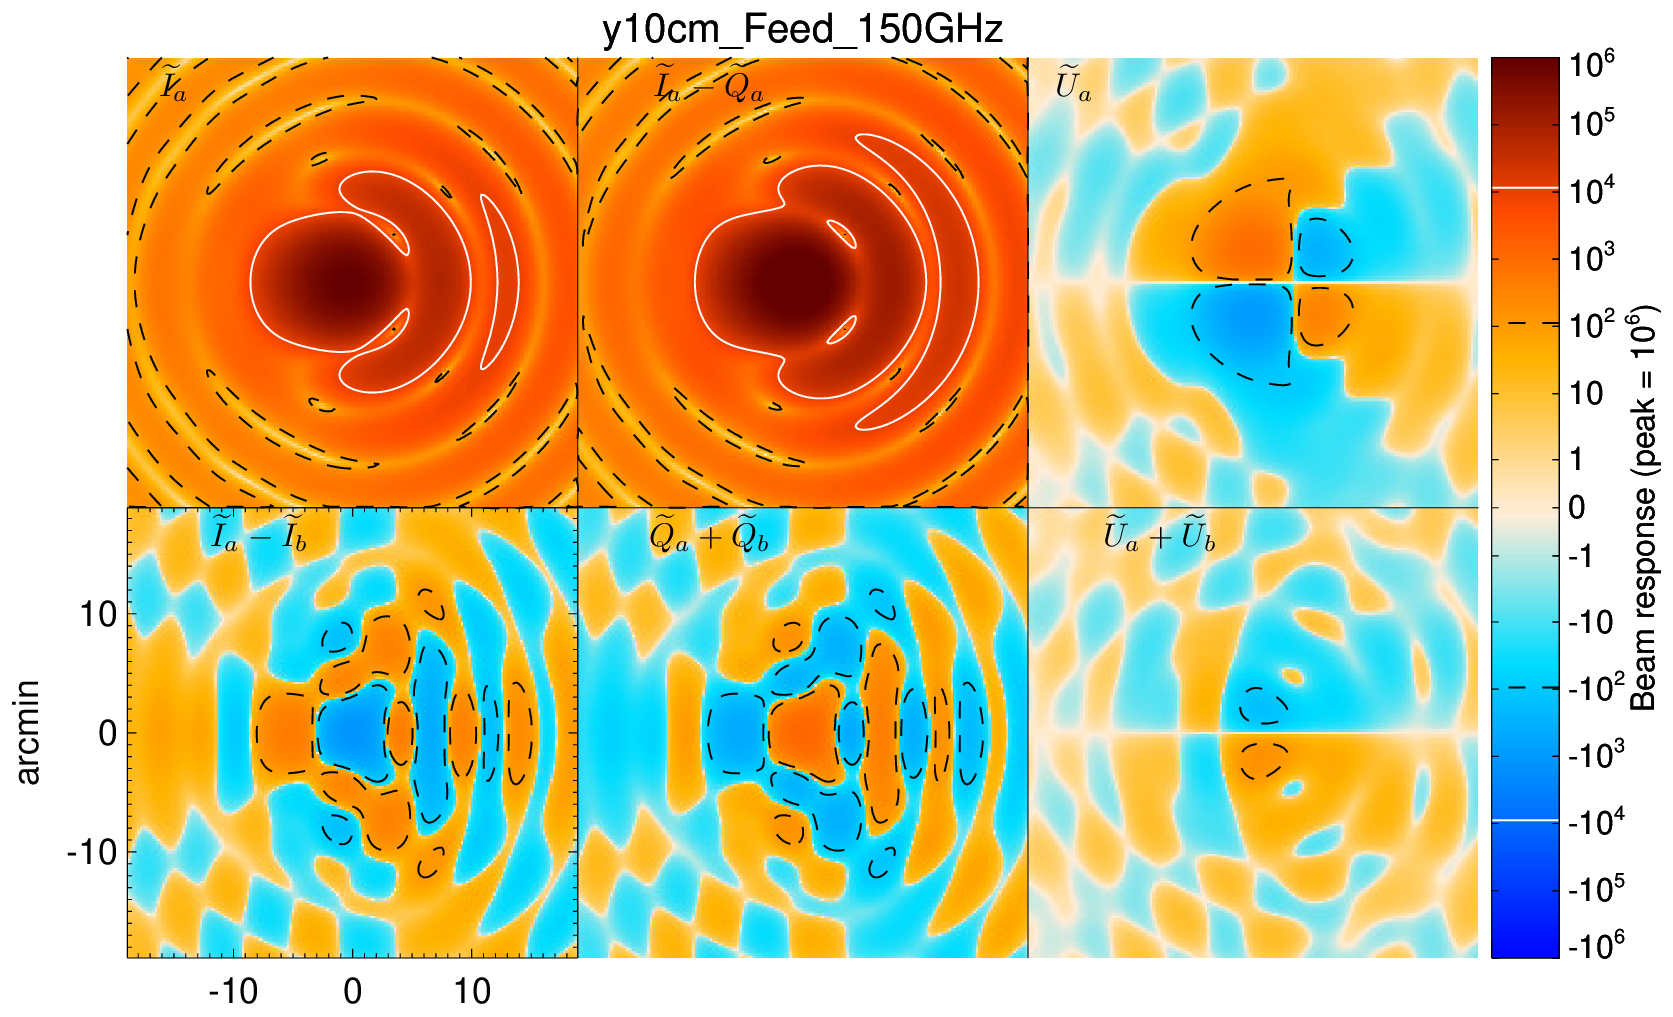
The beam computed at 150GHz, at a location offset by 10cm in the X (=co-scan) direction is now also available, on top of the central beam and Y=10cm beams generated earlier this month.
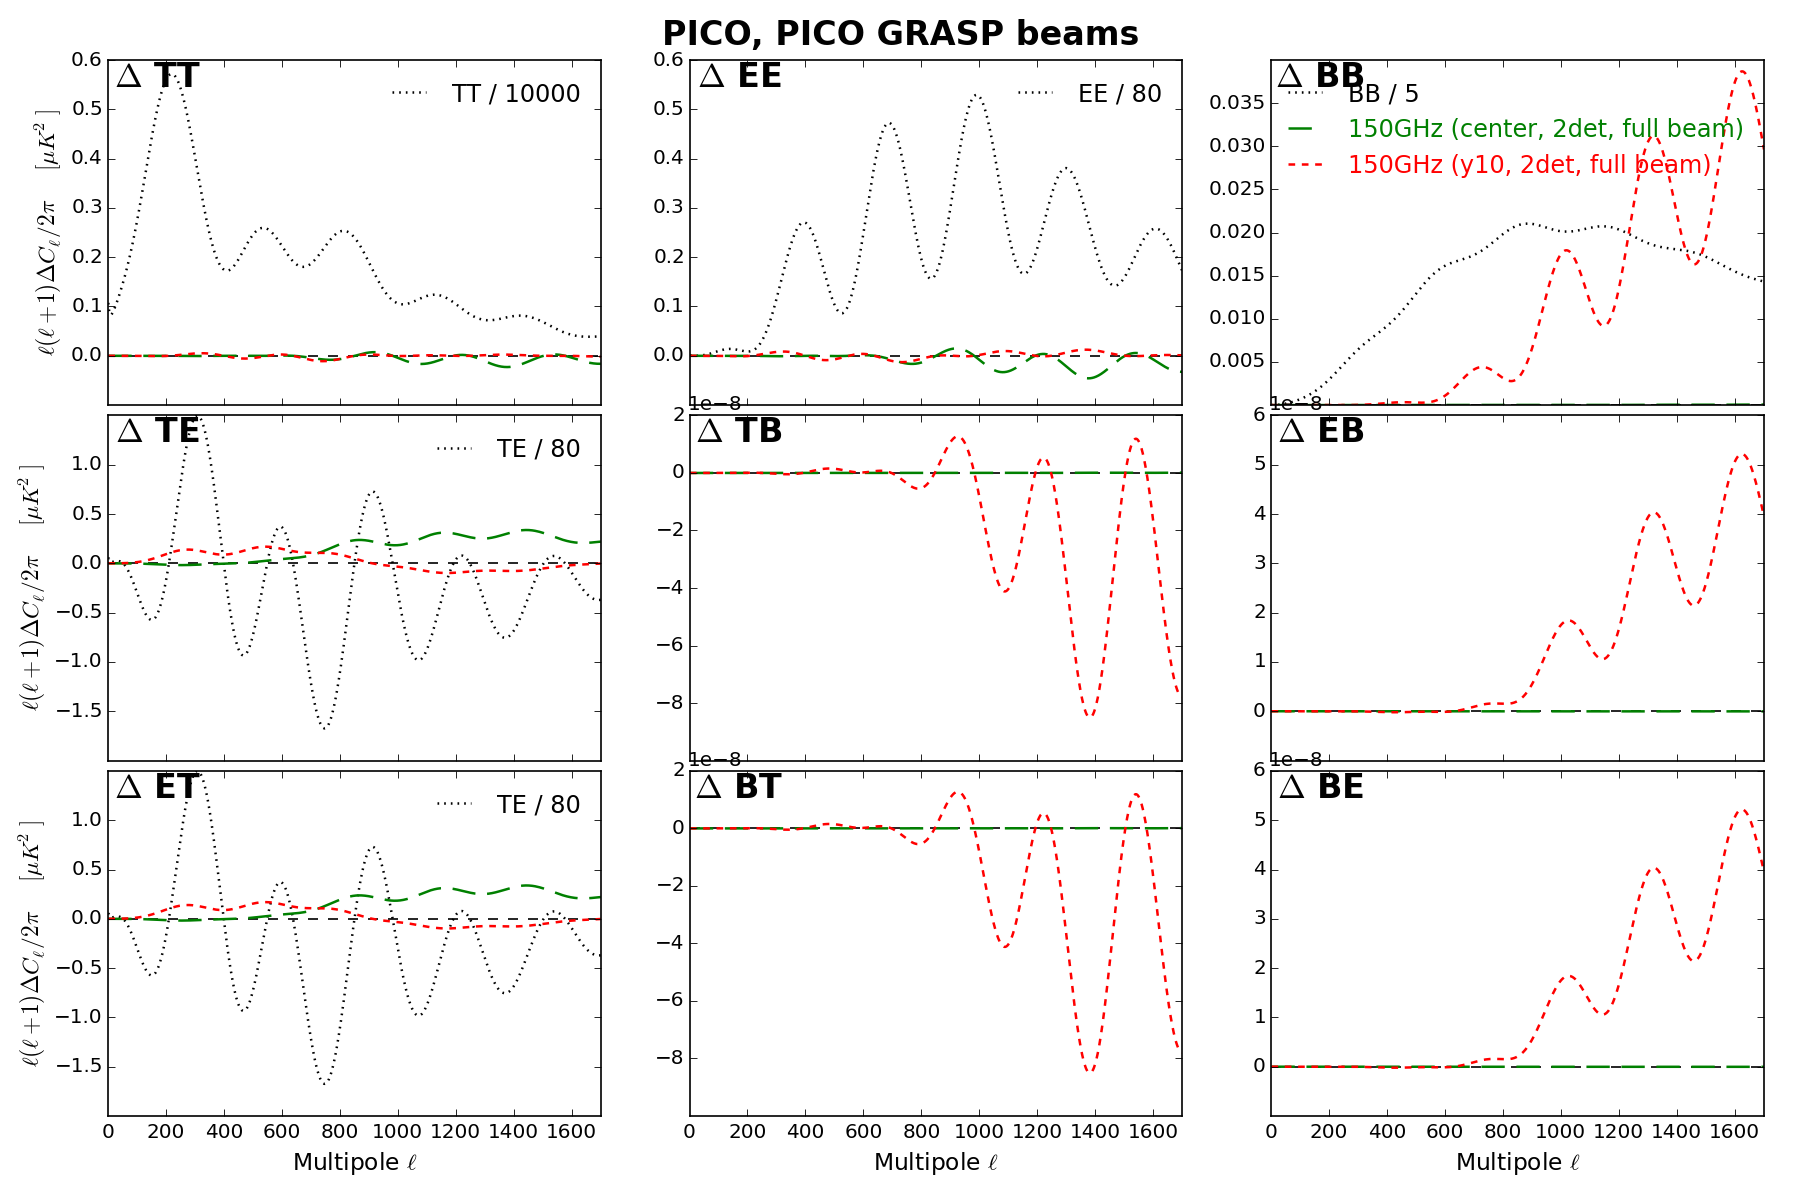
Two different effects are now visible on the power spectra:
- an overall rotation of the polarization by ~1.73 deg, showing up as a strong EE to BB leakage when the full IQU beam is used instead of assuming a copolar beam (something we did not see in the (X,Y)=(0,0) and (0,10cm) cases)
- the ell-dependent leakage from EE to BB seen previously is now larger than before.
2018/07/13
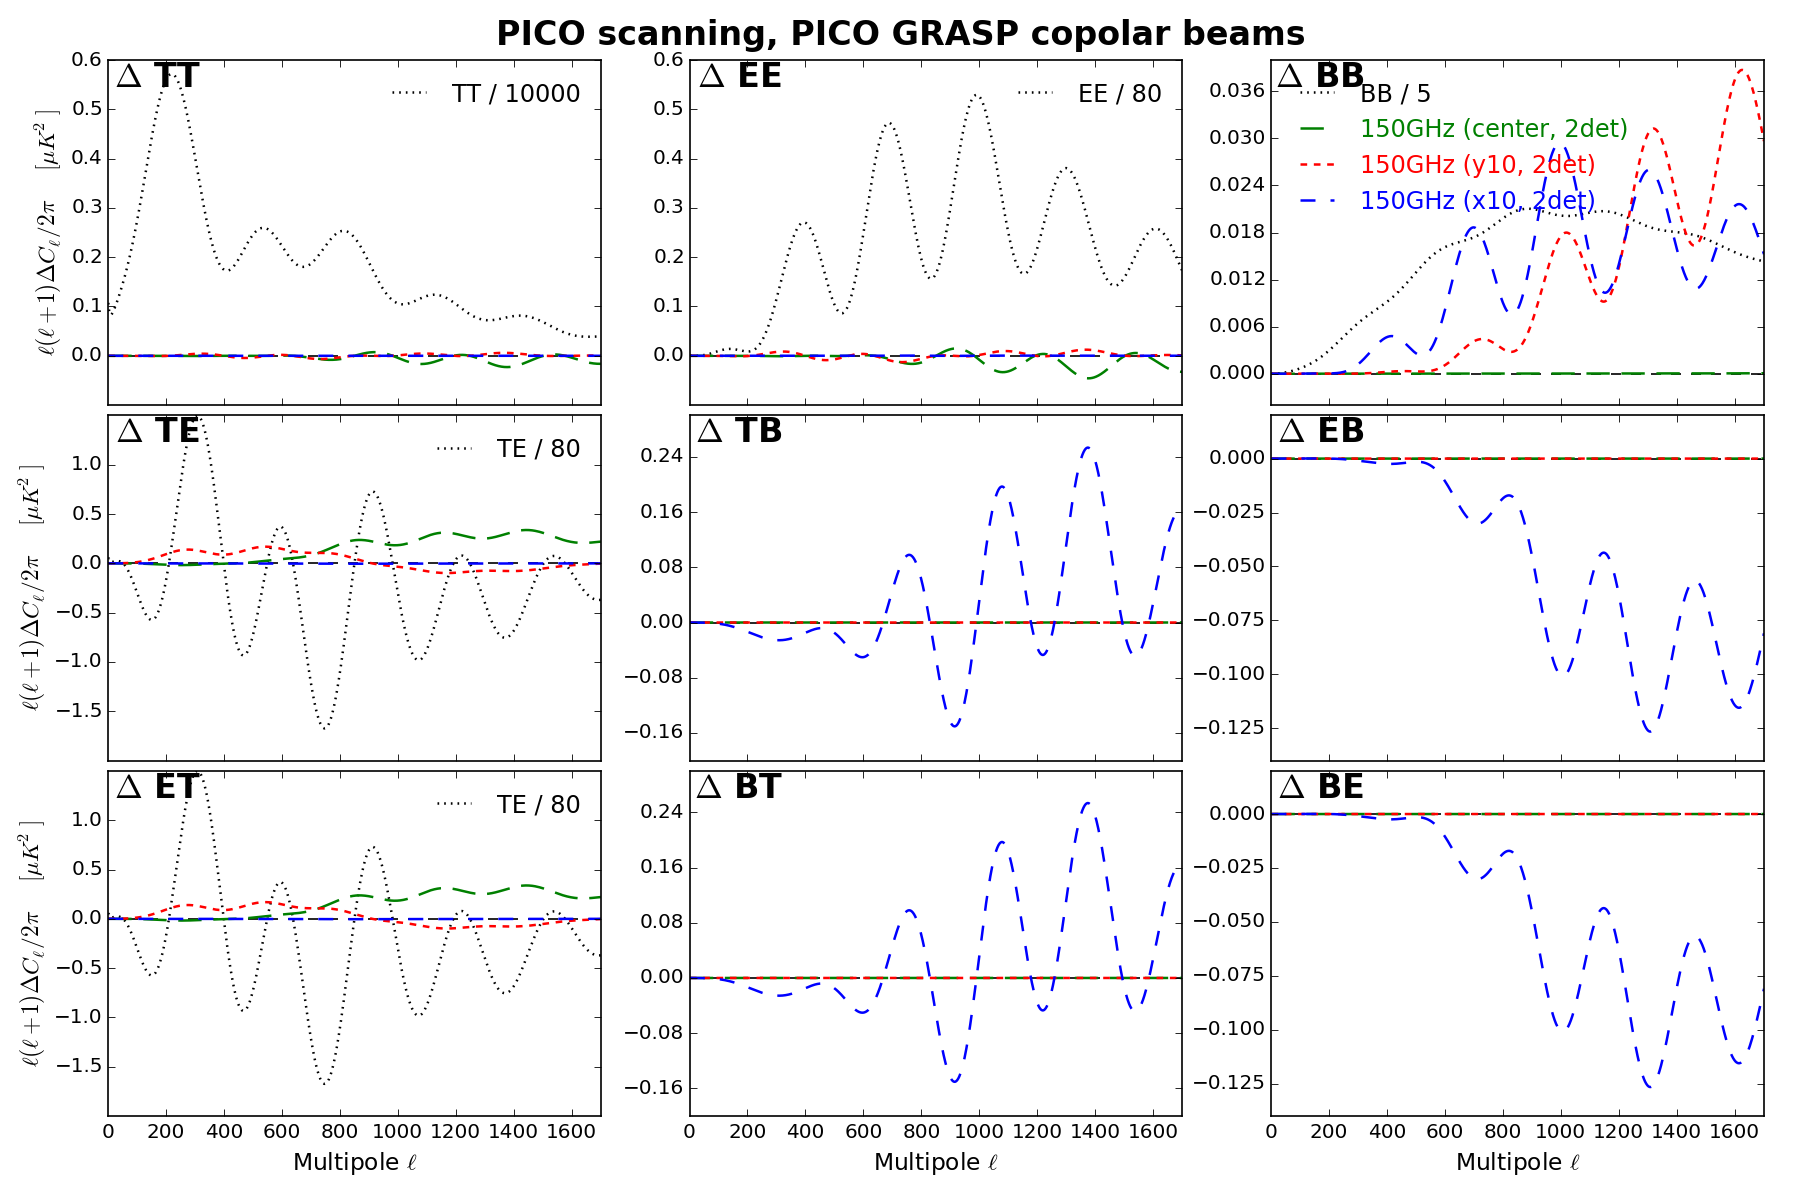
Same exercise as on July 02, this time considering a beam at 150GHz located 10cm in the Y (=cross-scan) direction from the focal plane center (in a focal plane of 45cm in diameter).
We see this time a much larger contamination of BB, which looks like an ell-increasing leakage from EE to BB, probably due to the m=4 components (=square-like shape) of the beam map.
As for the central beam, the pure copolar and full IQU beam models return the same power spectra.
2018/07/02
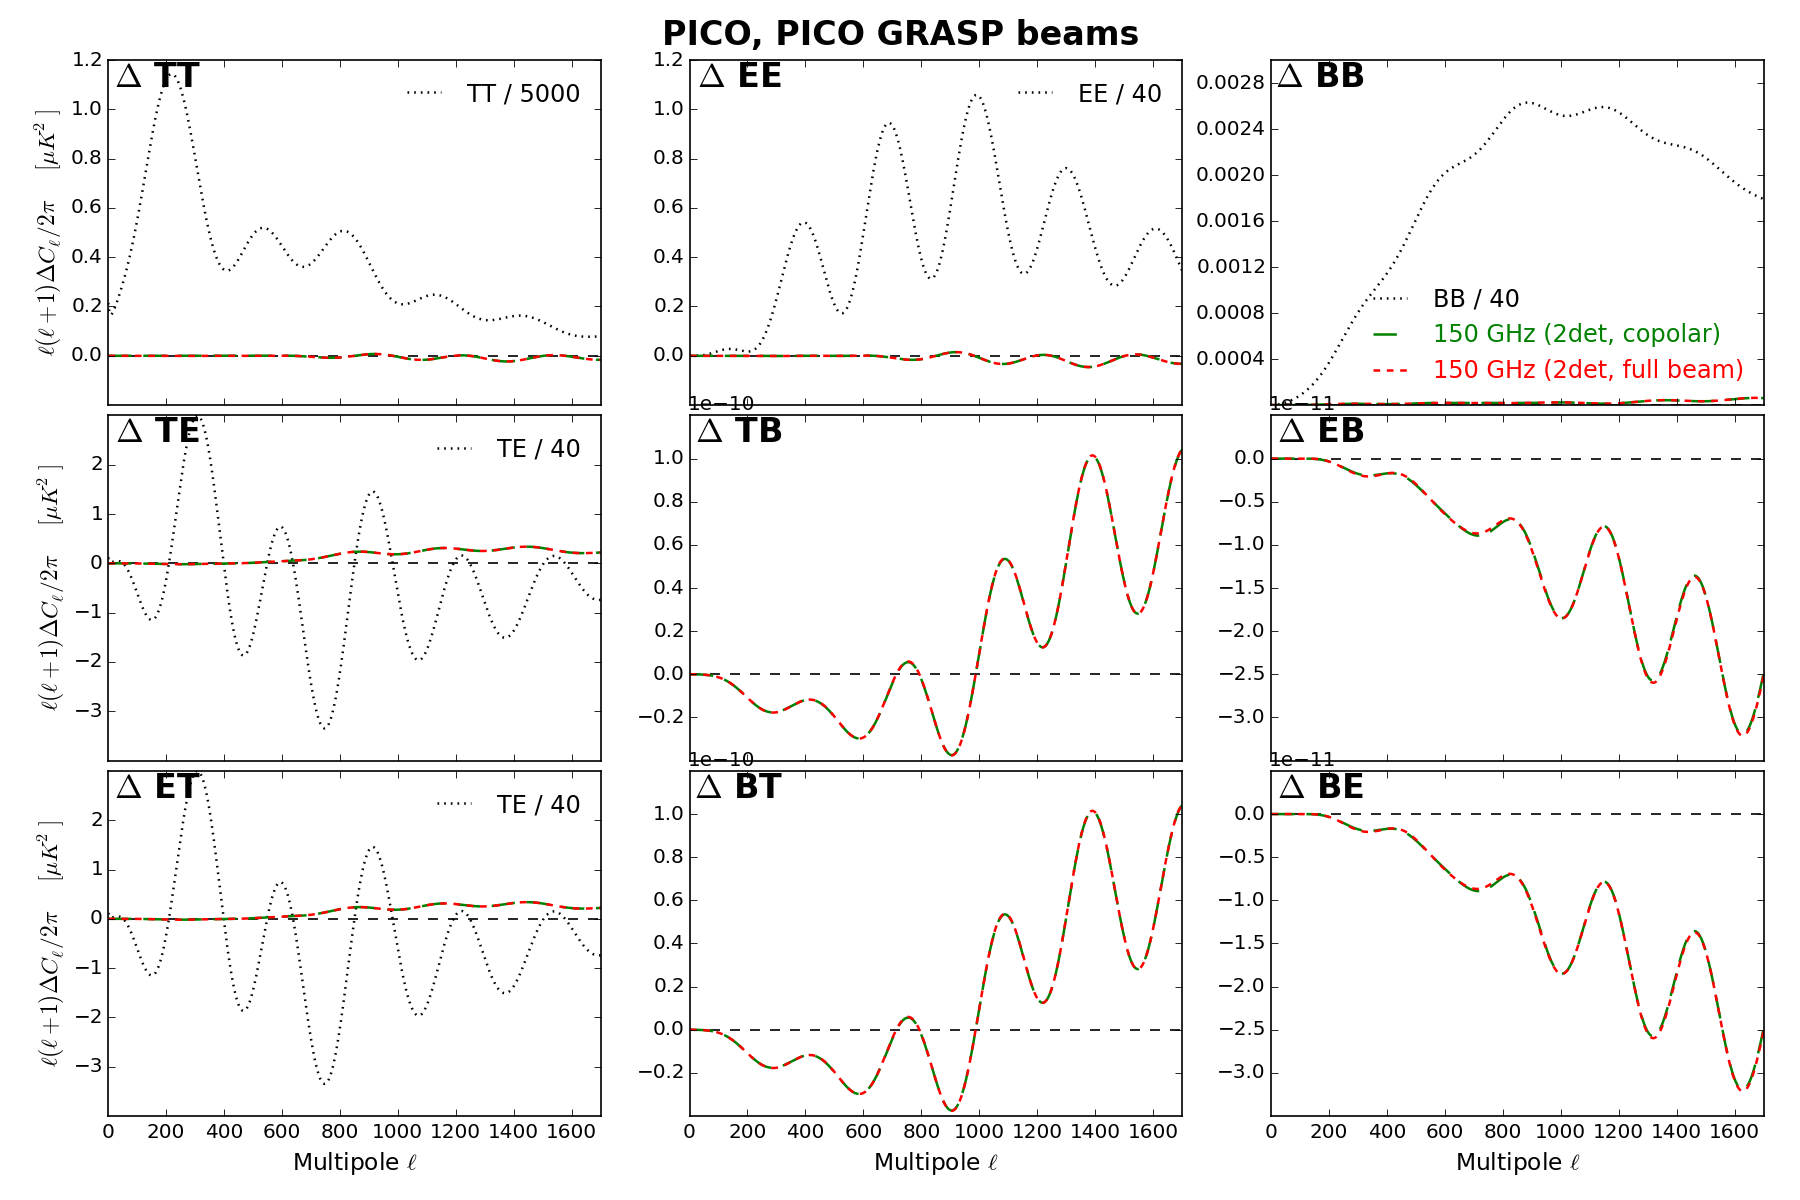
First GRASP simulations by Karl Young of PICO main beam responses at 150GHz at the center of focal plane, for 2 orthogonal detectors.
The FWHMs were found to be ~4.9arcmin, the elongations (ratio of the major and minor axes) 1.01,
and the ratios of U/I about 1.e-4 for both beams, meaning that the beams are very much co-polar, with very little spurious rotation (~<0.5 arcmin).
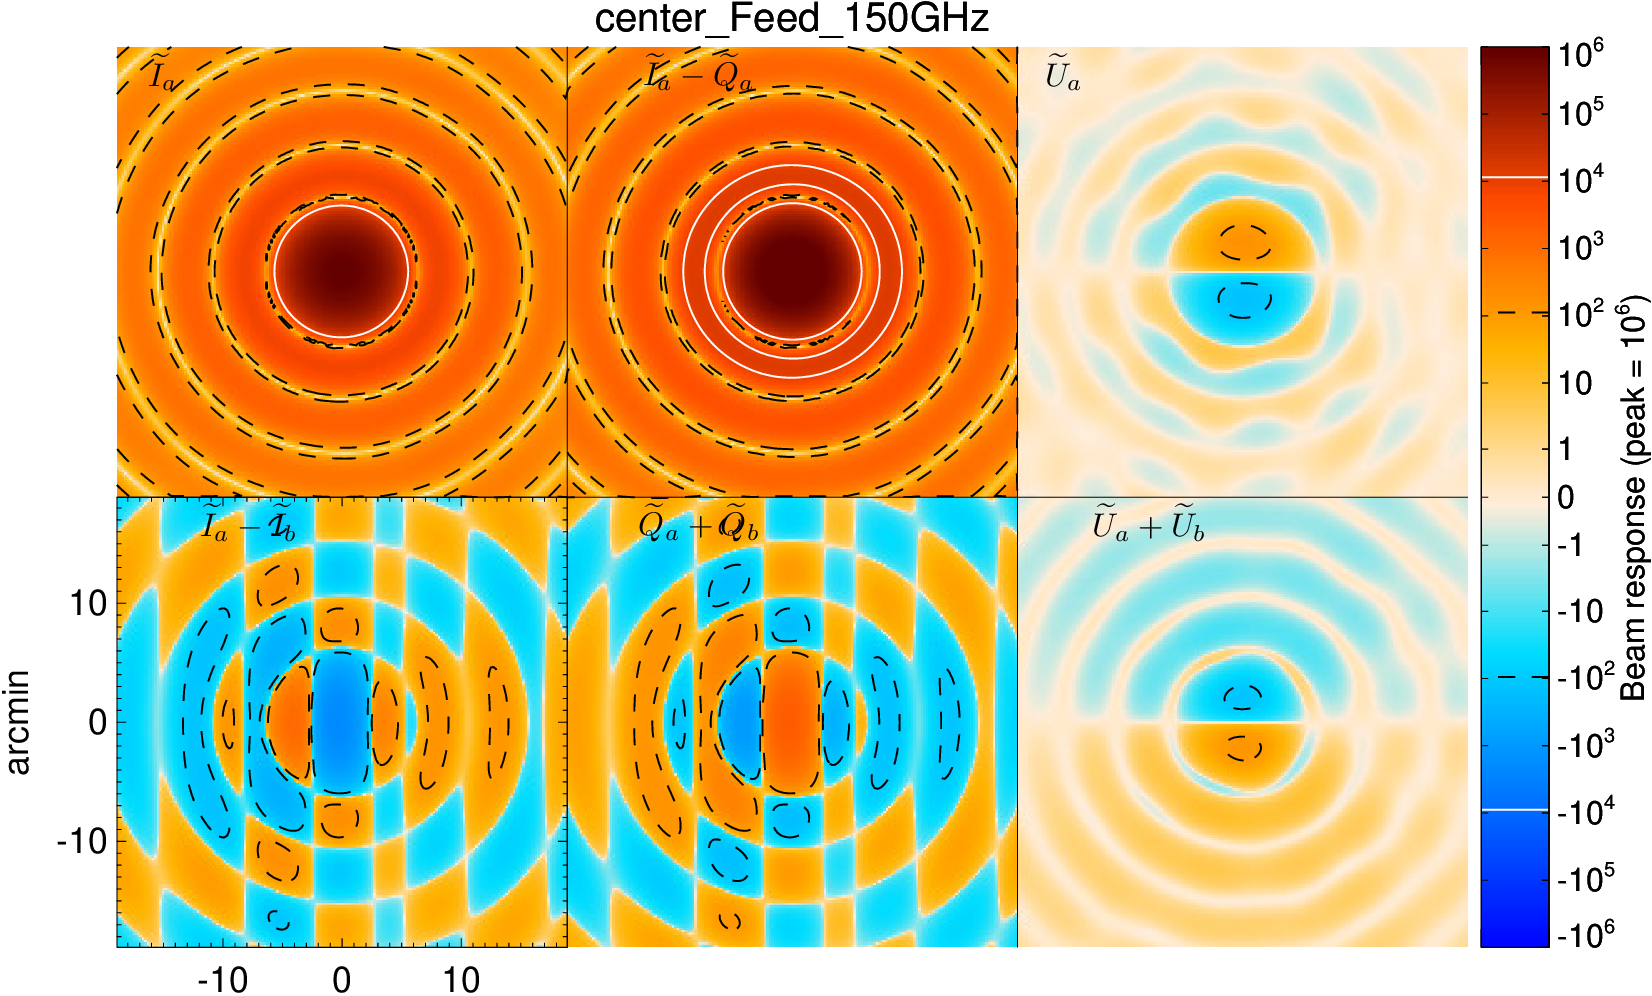
The same exercise would have to be repeated at a more representative position (ie, off-axis) where systematics (=elongation of beam and rotation of polarization) could be larger.
The plot below shows how the various spectra are affected for either the purely copolar beam (ignoring the U beam component, green dashes) or the “full” beam (red dashes), as computed by QuickPol assuming a scanning strategy adapted from July 1st 2018 baseline (α=30º, Tprec=10h, β=65º, Tspin=1mn, sampling = 151Hz, 2 years of observation, Nside=1024).