Table of Contents
Beam sidelobes simulations with Conviqt
Software versions
Configuration
- 1 pixel in band 12 at 154.80 GHz
- 4 detectors, 0,90,45,135 degrees
- realistic beams with center masked (
center_150GHz_mask400px5d_l720_alm.fits) - boresight pointing
- PySM input sky
- 1 year
Discussion and plots
- Also scattered among daily updates on the systematic effects telecon page
Summary plots
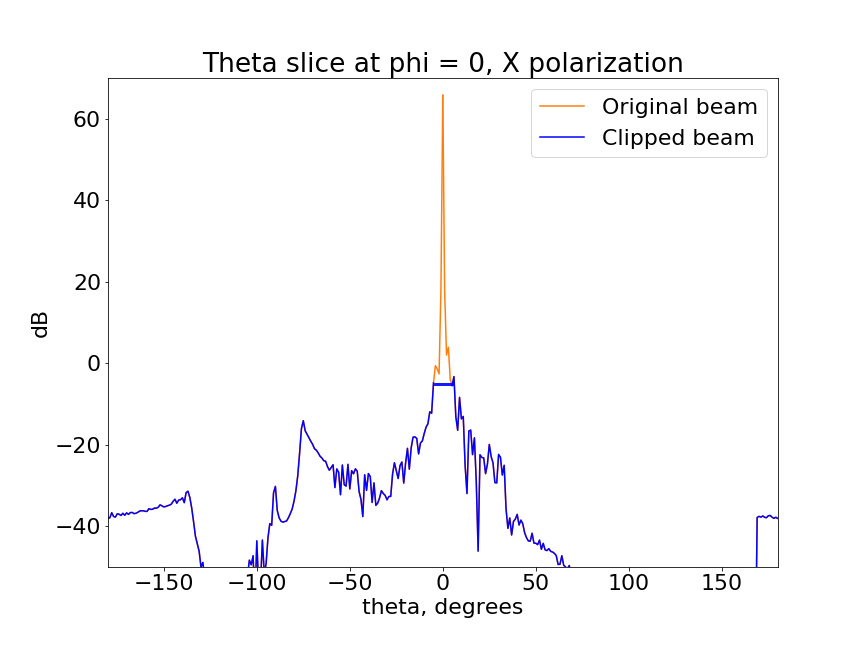
- 4 pi beams, main beam is at the plot center:

- These beams had the central 10 deg peak removed and filled with the value of the neighboring pixels. This clipped beam was then used in conviqt. Original and clipped x-pol beam:
 y-pol is similar.
- Input Galaxy maps, smoothed to 10 deg:

- Ouput maps from Conviqt nside=512:

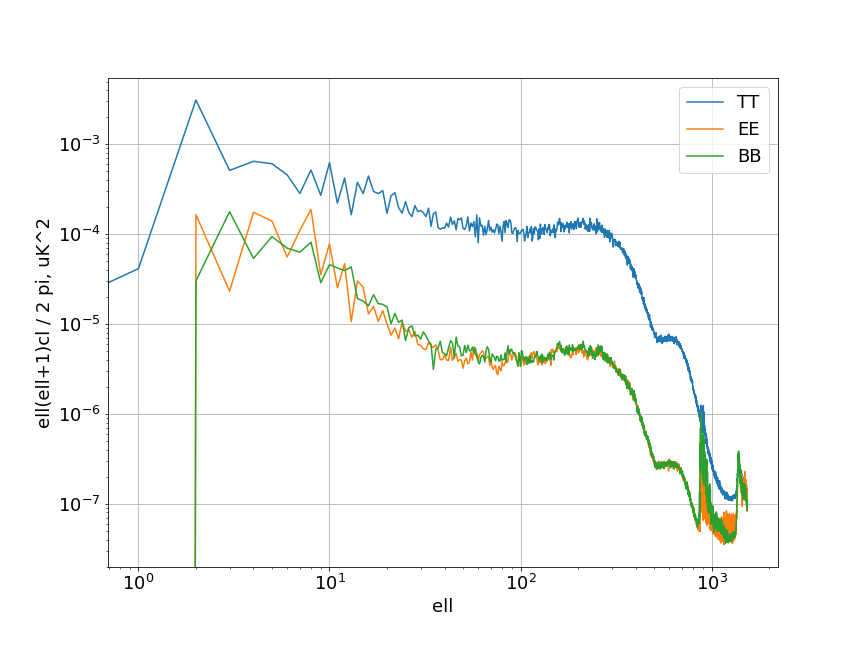
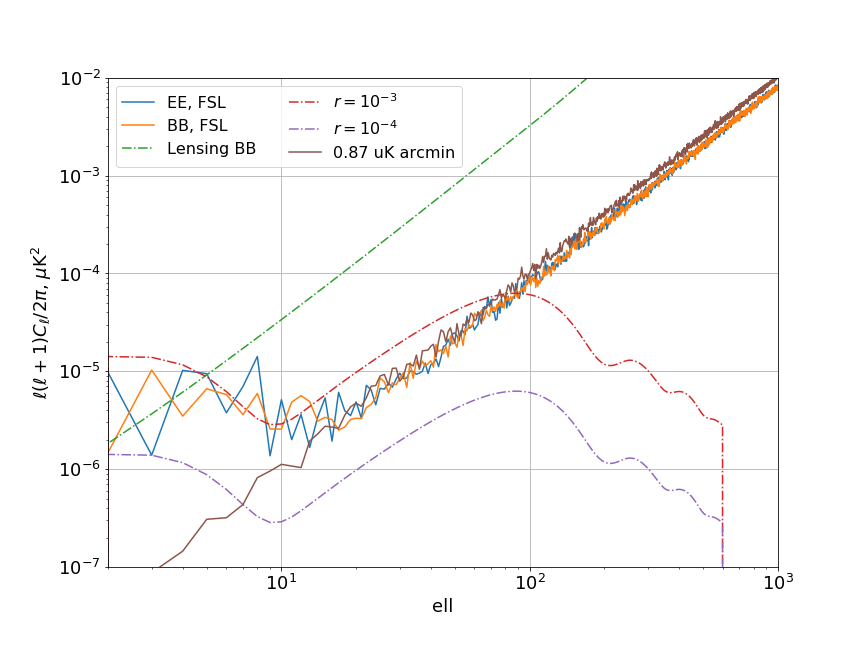
- Power spectrum of far sidelobe map masked with 43% Planck mask:

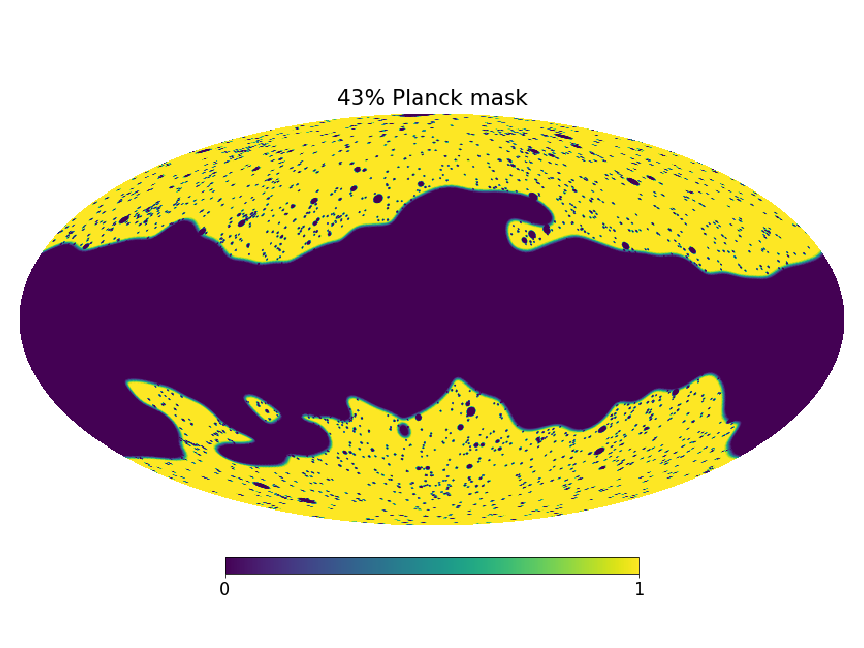
- Mask:


Partial cleaning
To give some idea of what level of removal is necessary I multiplied the sidelobe by a scaling factor, alpha, and added noise then recalculated the Cl's. I based the scaling factor on the map noise level for these 155 GHz detectors.
Possible noise levels to compare sidelobes to:
- Depth for 1 year for 1 wafer is 0.1 uK deg.
- Depth for 5 year for 1 wafer is 0.05 uK deg.
- Depth for 5 year for all 6 wafers is 0.02 uK deg.
- Depth for the full mission is 0.01 uK deg.
Intensity of sidelobes, all units are uK, Q and U are the median and max of absolute value of Q, U:
| I | Q | U | ||
|---|---|---|---|---|
| Masked map | Mean | 0.10 | 0.018 | 0.015 |
| Max | 0.21 | 0.12 | 0.11 | |
| Full map | Mean | 0.28 | 0.022 | 0.014 |
| Max | 2.6 | 0.58 | 0.14 | |
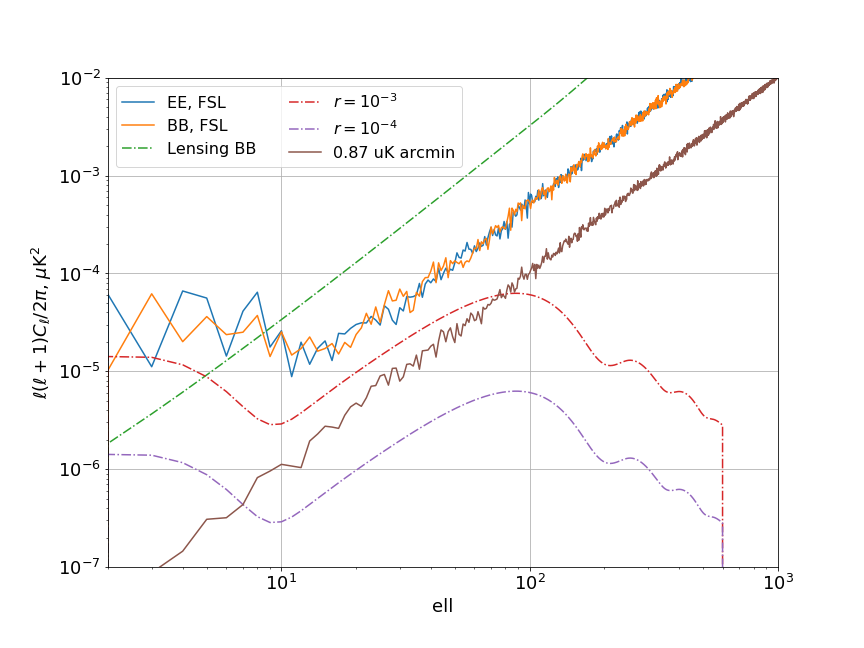
When looking at the masked map, which is what makes sense for B-modes as this is the cleanest 40% of the sky, the average polarized sidelobe level is less than the map noise. This takes away the simplest option of reducing the sidelobe power until its average is equal to the noise level. Instead I reduced the sidelobe power until the max in the maxed region was approximately at the noise level. This gives the following power spectra.
- Power spectra for masked FSL, no noise added.

- Power spectra for masked FSL*0.6 + 0.05 uK deg noise:
 (1 wafer 5 years)
 - Power spectra for masked FSL*0.25 + 0.02 uK deg noise:
 (6 wafers 5 years)
 - Power spectra for masked FSL*0.10 + 0.01 uK deg noise:
 (Full CBE mission)

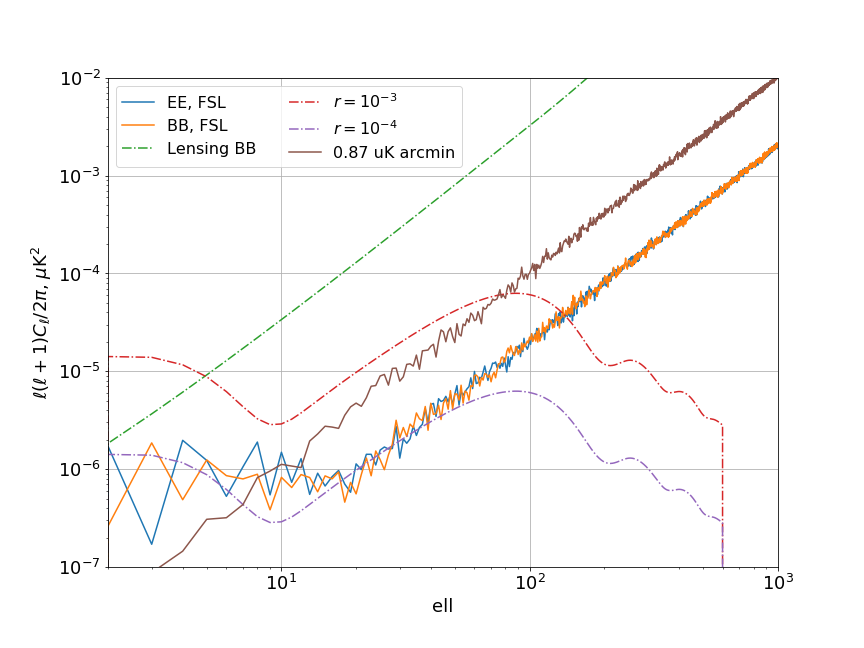
For these power spectra I multiplied by the FSL map by alpha, added white noise where each map pixel value is drawn from a gaussian with sigma equal to the quoted noise level (scaled to appropriate pixel size, nside=512), and applied the galaxy mask. The power spectra are calculated using the healpy anafast function.
Bottom line: We need to remove about 60% of the sidelobes to get to r of 10^-3 and about 90% to reach r = 10^-4
Results location
NERSC
/global/cscratch1/sd/zonca/pico/conviqt_sim/201810_boresight_1pix4det_conviqt_realbeams_mask5deg_1y
tape
~zonca/pico/conviqt_sim/201810_boresight_1pix4det_conviqt_realbeams_mask5deg_1y